
Short Answer: Yes, keep reading for the details!
Edit: I wrote the majority of this on August 4th before the Braves beat the St. Louis Cardinals and ended their streak of non-consecutive wins and losses. At the time of this posting, the Braves are .500 (54-54). This post is based on their first 107 games through August 3rd (inclusive) of the 2021 season.
The 2021 Atlanta Braves season so far…
The 2021 Atlanta Braves record following their game on August 3rd, 2021 is 53 – 54. They have broken the record for the longest consecutive streak of games without having the same result (18 games). That is, the Braves have not won or lost twice in a row in their last 18 games. The Braves surpassed the previous record of 16 that was shared by 3 teams: the 1974 Phillies, 1981 Dodgers, and 2010 Rockies. Technically, there’s an asterisk next to this record since their July 21st game against the San Diego Padres was rained out in the middle of the game, which means once it’s completed later this year, this streak will technically be broken up. Nevertheless, the Braves’ now hold the record for the most consecutive completed games (18) without winning or losing more than one game in a row. A record to commemorate their extraordinary consistent mediocrity so far this season.
And it’s not just this lone 18 game stretch that defines this Braves team’s extremely average season. With respect to a .500 record, the Braves have not been lower than 5 games under .500, or higher than exactly .500. That’s only a 5 game spread between their highest and lowest points this season with respect to a .500 record over 107 games played so far. Below is a histogram of the Braves record over the course of the season with respect to time spent +/- .500.

And to give credit where it’s due, a similar histogram of the Braves record was posted to the /r/braves subreddit on Reddit a few weeks ago, and not much has changed for the Braves since then. The Braves have continued their streak of extremely consistent mediocrity. And this got me thinking, how rare is this? At this point in the season, are the Braves truly the most consistently mediocre team of all time?
So how consistently mediocre are they?…
To investigate this, I web-scraped every MLB team’s record for every season since 1901 from baseballreference.com. I excluded seasons that had fewer than 107 games played (looking at you 2020…), and summarized every team’s season record over the course of their first 107 games. In total, that’s 2,489 MLB team seasons to compare this years Braves team to. So here are the things I wanted to look at:
Mediocrity
The Braves have not been lower than 5 games below .500, or higher than exactly .500. They have been a very mediocre ball club. But how mediocre are they? To assess this, we’ll define “mediocrity” as how far a team deviates from a .500 record over the course of their season. To find this out, I looked at the absolute difference from .500 for every team season since 1901 after their first 107 games. Only 42 times (1.7% of all team seasons played) has a team deviated from .500 by only 5 games or less. On 10 occasions, a team did not deviate by more than 4 games +/- .500 after their first 107 games. The most mediocre teams in history are actually:
- The 1984 Montreal Expos
- 1940 Chicago Cubs
- 1906 St Louis Browns
- 1998 LA Dodgers
- 1962 Baltimore Orioles
- 1911 Chicago White Sox
- 1962 Chicago White Sox
- 1926 Detroit Tigers
- 1971 Houston Astros
- 2021 Philadelphia Phillies
And on 32 occasions has a team deviated by 5 games +/- .500 (including this years 2021 Atlanta Braves). This means that the Braves are among the top 2% most mediocre teams of all time (after 107 games into a season). While certainly a rare occurrence, its not unheard of. In fact, the Braves aren’t even the most mediocre team this year – that title goes to the Philadelphia Phillies who haven’t been lower than 4 games below .500, or 4 games above .500. But consistency is a different story…
Consistency
We’ll define consistency by the spread and the standard deviation of a team’s record w/ respect to .500 over their first 107 games. Again, the lowest the Braves have been with respect to .500 is -5 games and the highest is exactly .500 (e.g. +/-0 games). That absolute difference is a 5 game spread. This seems quite low and very consistent, how rare is this?
Very rare! The 2021 Atlanta Braves are the only team since [at least] 1901 to have a record spread of just 5 games w/ respect to .500 after 107 games into the season. To put this in further perspective, no team has ever even had a spread of 6 games around .500 after 107 games. Only 5 times has a team had a spread of 7 games around .500 after their first 107 games (The 1906 St. Louis Browns, 1940 Chicago Cubs, 1984 Montreal Expos, 1993 Seattle Mariners, and 2005 Toronto Blue Jays). Only 30 times has there been a spread of 8 games around .500 after 107 games, and only 62 times has their been a spread of 9 games. To sum up, only 98 times (3.9% of all MLB team seasons consisting of at least 107 games) has a team’s record around .500 varied just 9 games or less after 107 games played… and the Braves are definitively the lowest ever.
Even among the 10 most mediocre teams ever defined above, they all had spreads of 7 or 8 games. For example the 2021 Phillies have a spread of 8 games (-4 to +4 +/- .500).
The fact the braves have not deviated further than 5 games w/ respect to their +/- .500 record demonstrates their extreme consistency in mediocrity.

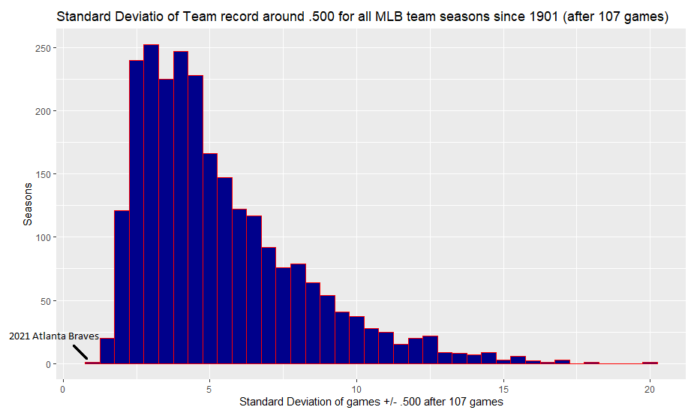
To further assess this, I was curious about the Braves record variability around .500 and how it compared to others in history. Note, the histogram of the Braves record over the course of the season +/- .500 (presented above) looks approximately normal, so assessing the standard deviation of their record provides a good measure of consistency around their mean record. And for comparison, I calculated the standard deviation (SD) of every team’s record with respect to .500…and here’s what I found:
The standard deviation of the Braves record w/ respect to .500 after 107 games is 1.13 – the lowest in history! The next 4 lowest rounding out the bottom 5 are:
- 2009 Minnesota Twins w/ a SD of 1.51
- Tie: 1959 Chicago Cubs and 1993 Seattle Mariners w/ a SD of 1.54
- Tie: 2013 Philadelphia Phillies and 1964 LA Dodgers w/ a SD of 1.55
- 2005 Toronto Blue Jays with a SD of 1.56
Notice how close the 2nd through 5th lowest teams of all time are – just a couple decimal places off, while the standard deviation of the Braves record (1.13) compared to the second lowest (1.51) is 25% lower! The Braves, by far, have the lowest variability in terms of record around .500 of any team since 1901.
And what does this [standard deviation] actually measure? Well, its another way of quantifying spread around a mean (average). For the Braves, their average record around .500 is -2.131 games (i.e. 2.131 games under .500). A standard deviation of 1.13 implies they’ve spent approximately 68% of their season at 2.131 +/- 1.13 games below .500, and 95% of their games at 2.131 +/- 2.26 below .500. No team in history has had such small variability around their mean record than the 2021 Atlanta Braves so far.
Conclusions: The 2021 Atlanta Braves, through their first 107 games played, are the most consistent, mediocre team in history (or at least since 1901)! Their current season is among only 2% of all team seasons since 1901 to have not deviated by more than 5 games from .500 after 107 games into the season. They are very mediocre. But more impressively, they have a smaller spread of games around .500 at this point in the season than any other team since 1901, and they have the lowest variability/standard deviation of their record around .500 than any other team since 1901, exhibiting their incredible consistency! They are simply exhibiting the most consistent mediocre season (after 107 games) in major league baseball history!
Well, what is the actual probability of this happening?
We only have 2,489 MLB team seasons to look at for real data, so how do we estimate the actual probability of something this obscure Braves season happening? To figure this out, we get a little more abstract. The question we seek to answer is this: What is the probability that a truly .500 baseball team would have such little variation after 107 games into the season? To first assess this, we make the following assumption:
- We assume that a team has exactly a 50% chance of winning a baseball game on any given day.
- In reality, this isn’t exactly true for several reasons:
- Baseball games are played in series. So an average team would have a little higher than a 50% chance to win several games in a row against a below average team, and vice versa for an above average team
- Probability of winning any given game is also dependent on pitcher rotation and/or temporary player injuries
- Taking these into account in a simulation would get incredibly complex.
- But this assumption might get us close enough to answer the question we’re interested in…
- In reality, this isn’t exactly true for several reasons:
Simulation
I simulated 10,000,000 independent 107 games seasons, for which each game of the season there was a 50% probability of winning or losing. For each season, I tabulated the team’s record over the duration of their season, and recorded the spread of their record w/ respect to .500 and the standard deviation.
Results
Assumption check: First, lets check if the assumption we make about each game having an independent 50% win probability is reasonable. To do this, I want to compare the estimated distribution of the spread of team records w/ respect to .500 from the simulation (again, which assumed teams truly have a 50% chance of winning) to that of teams who in reality were .500 teams. To do this, I first pulled only team season data for seasons where a team ultimately finished their season within 16 games of .500. Why 16 games? My rationale for this is because a record of +/- 16 wins around .500 out of 162 games yields a binomial proportion 80% confidence interval containing .500. In other words, There’s greater than 20% chance that a team that finished +/- 16 games around .500 has a true asymptotic record close to .500. Next, among these teams, I calculated the spread of their record w/ respect to .500 after their first 107 games of their season. I then overlaid this distribution with that from the simulation. That yields the following figure:

Wow! These distribution’s overlap really well. What we see in reality in terms of spread of record around .500 for true [approximately] .500 ball clubs matches really close to that of simulated .500 ball clubs with an independent probability of winning any game being exactly 50%. What does this mean? It tells me that the assumption we made in the simulation seem quite reasonable, giving us a bit more confidence in our results! So lets get to them…
Results: Out of 10,000,000 seasons, in 315,433 of them did a team’s absolute difference in games +/- .500 not vary more than 5. That’s about 3% of the time, so not out of this world rare, but still pretty rare. Thus supporting the Braves are a very mediocre team, but they’re mediocrity is not 1 in a million (literally)..
But in terms of consistency, out of 10,000,000 simulated seasons, only 853 times did a team have a record spread of less than or equal to 5 games around .500. That’s an estimated probability of 0.00853% of seeing such a small spread as we’ve seen the 2021 Braves have. More impressively however, is that we only see a standard deviation less than or equal to 1.13 in 124 seasons out of 10,000,000. Thus demonstrating that the Braves consistency w/ respect to their record around .500 isn’t just rare… it’s incredibly rare. We’ll probably never see such a consistent team again.
Final Conclusions
The 2021 Atlanta Braves aren’t just consistent and mediocre, they are very mediocre and the most consistent mediocre team in baseball history since 1901… and by a rather substantial margin.
Please leave comments, thoughts, and questions if you wish!